


Get your pricing estimate
Smarter maintenance starts with insights
Make faster, more confident maintenance decisions with real-time data and AI-powered insights. MEX gives you full visibility across assets, work orders, and costs, helping you identify trends, reduce inefficiencies, and act before issues escalate.


Real-time performance visibility

AI-powered reporting assistant

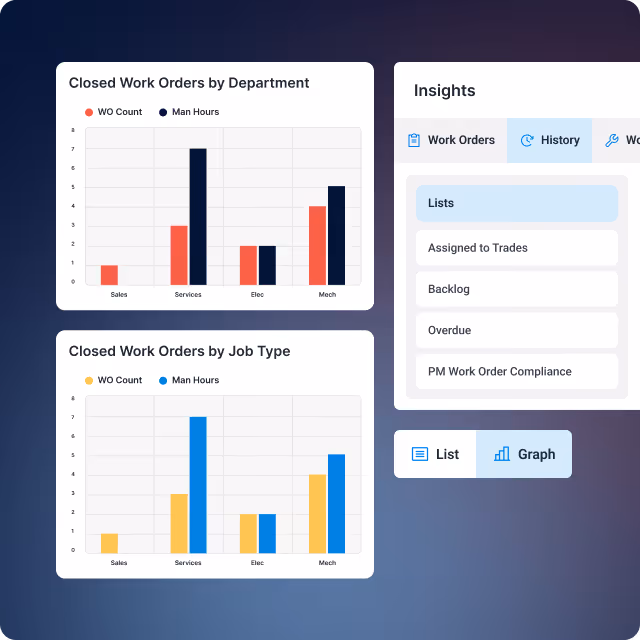
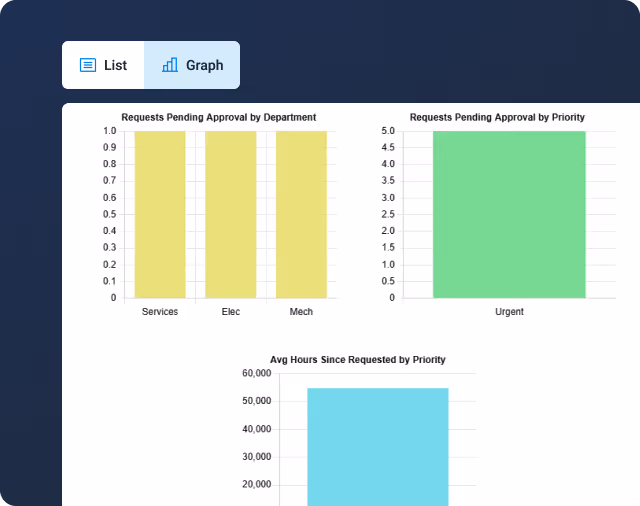
Interactive graphs and dashboards

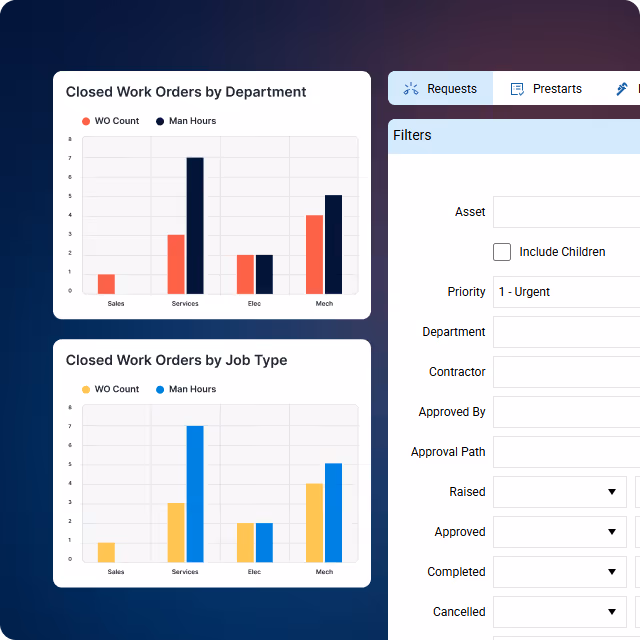
Drill-down data exploration
What is CMMS reporting & analytics?
CMMS reporting and analytics turns maintenance data into actionable insights, helping teams track performance, identify trends, and make informed decisions. MEX delivers this through real-time dashboards and AI-powered insights, allowing users to explore data, generate reports instantly, and ask questions in plain language.

Total maintenance visibility
CMMS reporting brings together work orders, assets, maintenance history, labour, and costs in one place for a clear view of performance.

Faster decision-making
Turn maintenance data into clear insights to identify trends, prioritise work, and respond faster, improving efficiency and reducing risk.
.svg)
Real-time performance tracking
Monitor performance in real time, drill into records, and track key maintenance metrics to support continuous improvement and planning.

Reporting & analytics in MEX
MEX combines real-time reporting with AI-powered insights to give teams complete visibility across maintenance operations. From reducing manual reporting to improving decision-making, it helps organisations move faster, stay informed, and operate more efficiently.
.avif)
.avif)
Full visibility across your operation
See what is happening across work orders, assets, labour, and costs in one place. MEX centralises your data, with AI helping surface the most relevant insights across your operation.
Faster, more proactive decisions
Identify overdue work, asset performance issues, and workload imbalances faster. MEX uses real-time data and AI-powered insights to help teams prioritise work and stay ahead of problems.
More confident, data-driven planning
Use MEX reporting and AI-supported insights to plan, prioritise, and allocate resources with greater accuracy across your maintenance operation.

Ready to simplify reporting and get answers instantly?
See how MEX turns maintenance data into clear insights with AI-powered reporting.


Turn maintenance data into measurable results
Reliable, AI-supported insights that turn your maintenance data into clearer decisions, better performance, and stronger operational control.
Lower maintenance costs
Improved efficiency
Reduction in downtime


See how our customers use MEX


Explore more resources

Move from data to decisions faster
Discover how MEX combines real-time reporting with AI-powered insights to help you identify issues faster, improve performance, and reduce manual reporting effort.