
Adding a Graph KPI in MEX Dashboard
The New MEX Dashboard released in July, 2017 has taken on a new look, being based fully in HTML5. It comes with a suite of standard KPIs to assist you with quickly gaining access to the status of your maintenance activities. However, the Dashboard is customisable, meaning that like MEX’s Reports suite, you’re able to edit these standard KPIs, as well as create your own to report on what is relevant to you. Below, we’re going to go through how to create a Graph KPI in the new MEX Dashboard.
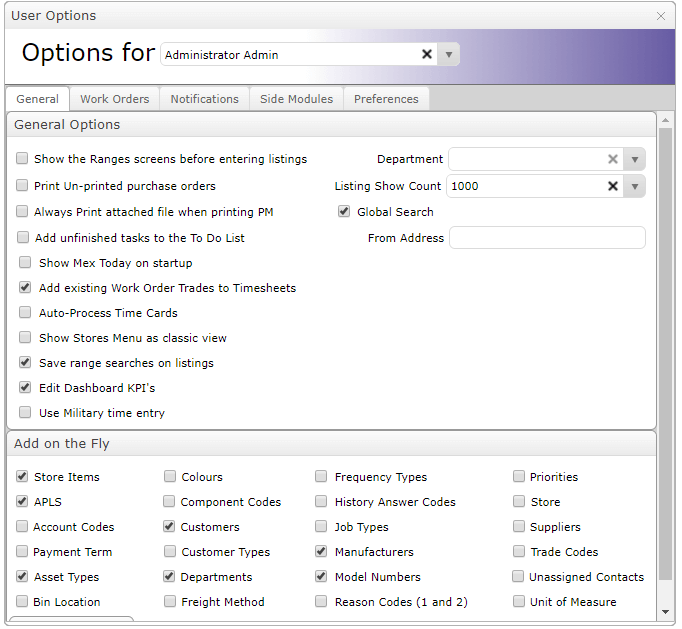
Note that in order to create and edit Dashboard KPIs, this will need to be enabled in your User Options;
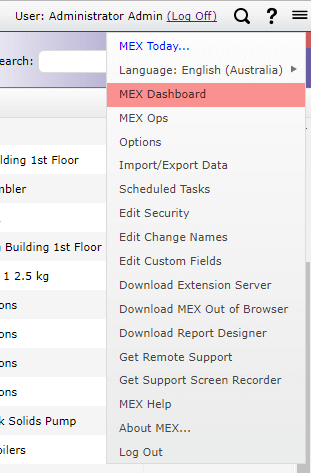
You’re able to access your MEX Dashboard from the hamburger menu found in the top left-hand corner of your MEX screen;
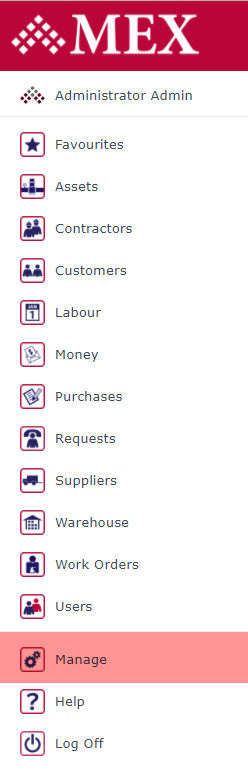
Once in the Dashboard, login with your credentials. On the left-hand side of the screen, underneath the different Categories, you’ll see an option that says ‘Manage’. Select this option to bring up another dialogue box.
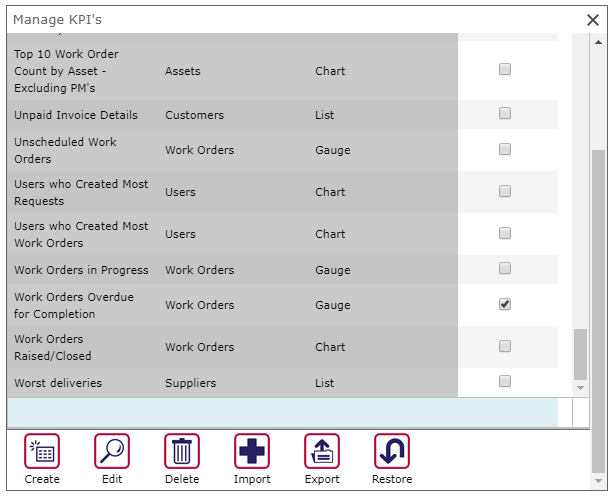
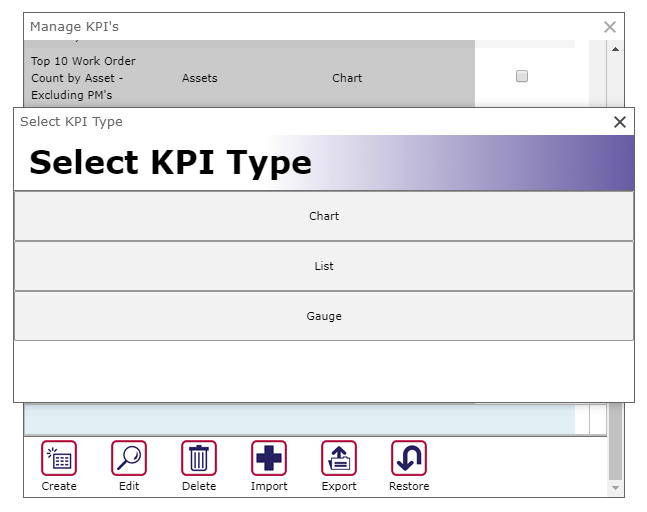
Once in the ‘Manage KPIs’ area, scroll down to the bottom to see additional options. We’re going to select the ‘Create’ button;
Next, when prompted, we’re going to select the KPI type – in this example, we will select ‘Chart’;
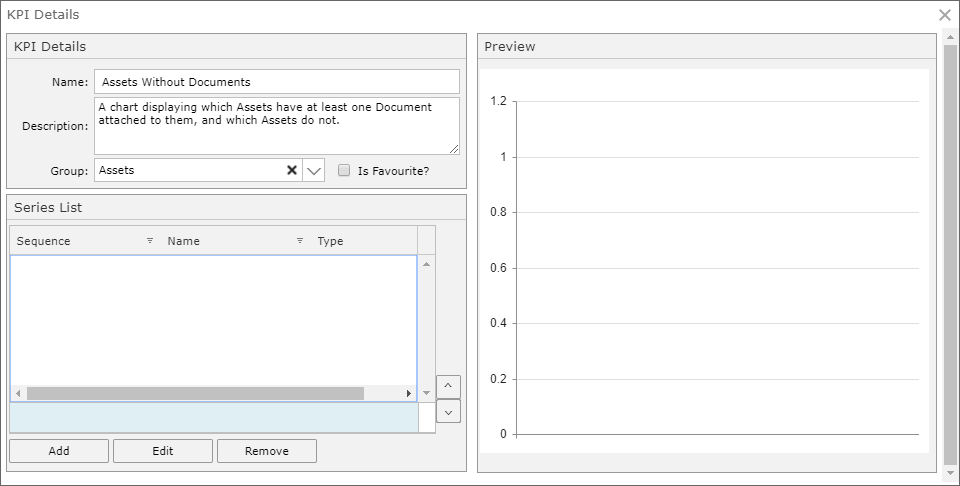
In the next screen, we are shown a box with the KPI details. Let’s begin by populating the Name and Description fields, for example:
- Name: Assets Without Documents
- Description: A chart displaying which Assets have at least one Document attached to them, and which Assets do not.
- Group: Assets
Next, to add our Datasource (SQL Query), we’re going to select ‘Add’. This will bring up another box, allowing us to input our Datasource, and choose which kind of graph we would like to visualize our data.
In this example, we’re going to populate Series Name, Series Type and List Datasource. We’ll leave the other fields as standard.
- Series Name: Series 1
- Series Type: Pie
- List Datasource:
SELECT DocumentStatus, COUNT(*) AS AssetCount FROM (
SELECT A.AssetNumber, CASE WHEN A.AssetID IN (SELECT EntityID FROM Document D WHERE D.EntityName LIKE 'Asset') THEN 'Has Document' ELSE 'No Document' END AS DocumentStatus FROM Asset A
WHERE A.IsAsset = 1) Data
GROUP BY Data.DocumentStatus
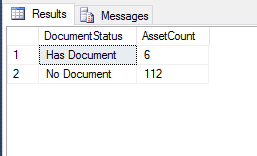
Please note, the above SQL query is a simple example for the purposes of this tech tip – this is a simple count of what Assets have IDs which feature in the Document table, then turning this into a COUNT query to list the totals. If it were to be run in SQL, the query would return;
Once you’ve filled out those details, exit out of this screen to save by selecting the X button in the top right. You should now see the query visually represented. The first column is automatically turned into the series, and added to a legend on the graph, while the counts in the second column are represented visually.
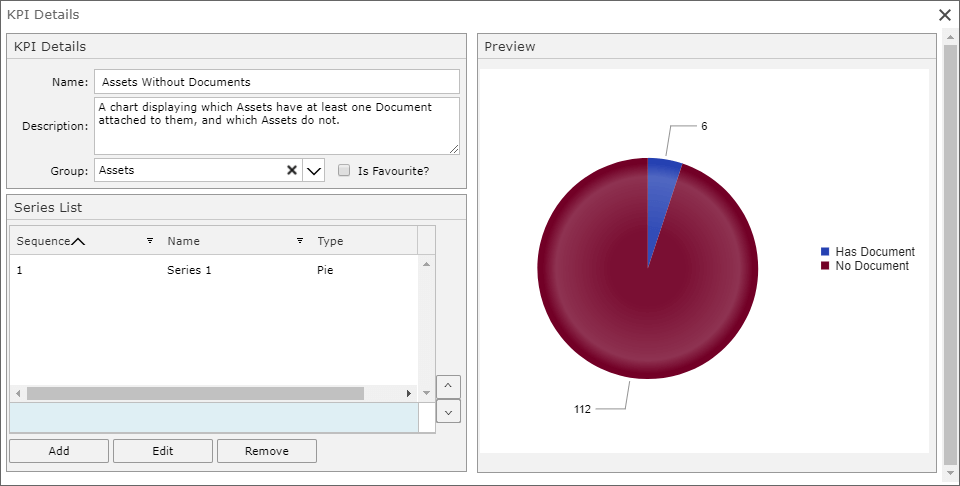
(Hint: Select ‘Edit’ again, to edit the datasource again and see what the different series types look like – some KPIs might look better as a bar graph, rather a line graph or a pie graph, or vice versa.)
Exit out again to return to the ‘Manage KPIs’ screen. From here, you can choose if you wish to make your newly created KPI a ‘Favorite’, meaning it appears upon the first loaded screen of the MEX Dashboard. Close out again to save.
Here’s another example Datasource you can try – this query is designed to show you what current open Work Orders have Trade lines added;
SELECT TradesAssigned, COUNT(*) AS NumberOfWOs FROM (
SELECT WO.WorkOrderNumber, CASE WHEN WO.WorkOrderID IN
(SELECT WorkOrderID FROM WorkOrderTrade WHERE WorkOrderID IN
(SELECT WorkOrderID FROM WorkOrder WHERE WorkOrderStatusID NOT IN
(SELECT WorkOrderStatusID FROM WorkOrderStatus WHERE WorkOrderStatusFunctionName LIKE 'Closed' OR WorkOrderStatusFunctionName LIKE 'Cancelled'))) THEN 'No Trades Assigned' ELSE 'Trades Assigned' END AS TradesAssigned
FROM WorkOrder WO
WHERE WorkOrderStatusID NOT IN (SELECT WorkOrderStatusID FROM WorkOrderStatus WHERE WorkOrderStatusFunctionName LIKE 'Closed' OR WorkOrderStatusFunctionName LIKE 'Cancelled')
) Data
GROUP BY TradesAssigned
Try adding it yourself as another example, and play around with the different Series Types to see how these look.
As a reminder, writing these SQL queries for Custom Views is not covered by the Support agreement, however our team are always on hand to help answer your questions as best we can, and steer you in the right direction to get the data you need in your listings. You can reach MEX Support on support@mex.com.au or on +61 7 3392 4777.