MEX Dashboard Takes On A New Look
The MEX Dashboard takes on a whole new look in the latest version of MEX V15.
We have gone away from Microsoft Silverlight and have built on the success of V15 by building Dashboard in HTML 5 as well.
Dashboard now takes on a scalable user experience with KPIs that appropriate to your screen size creating an easy to navigate maintenance information centre. With complete responsiveness you can take Dashboard with you and use it on the go, allowing you to monitor the state of your maintenance operation anywhere and at any time.
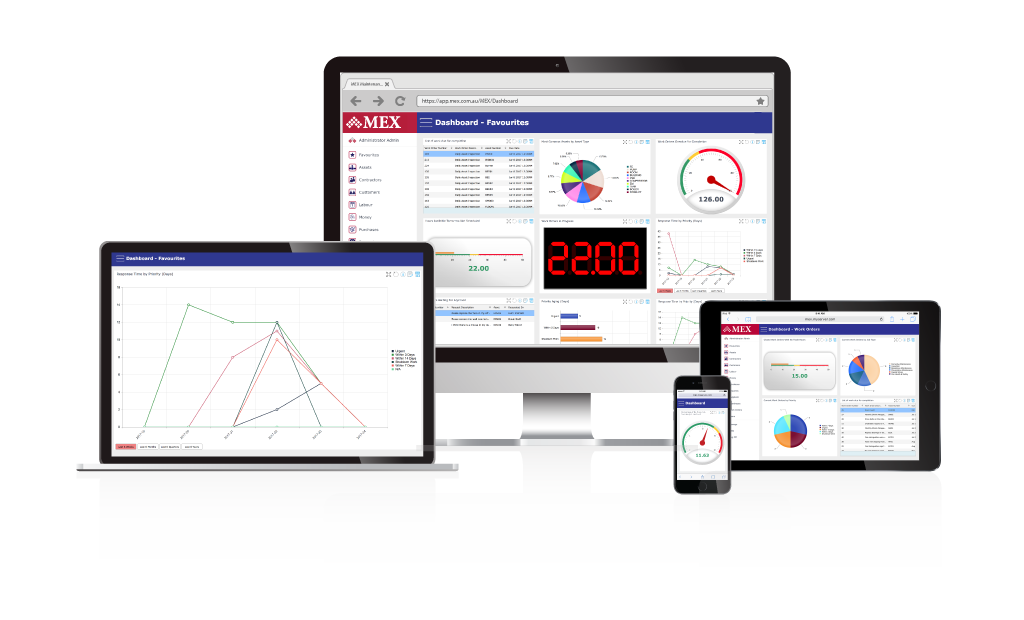
Visually, you have at the tip of your fingers a new Dashboard that instantly displays Key Performance Indicators (KPIs) in vibrant Lists, Radials, Linear, Digital and various types of Graphs. Detailing critical maintenance parameters such as Asset Maintenance Costs, the number of Work Orders due for completion, Staff Response times, and Hours available to schedule, just to name a few.
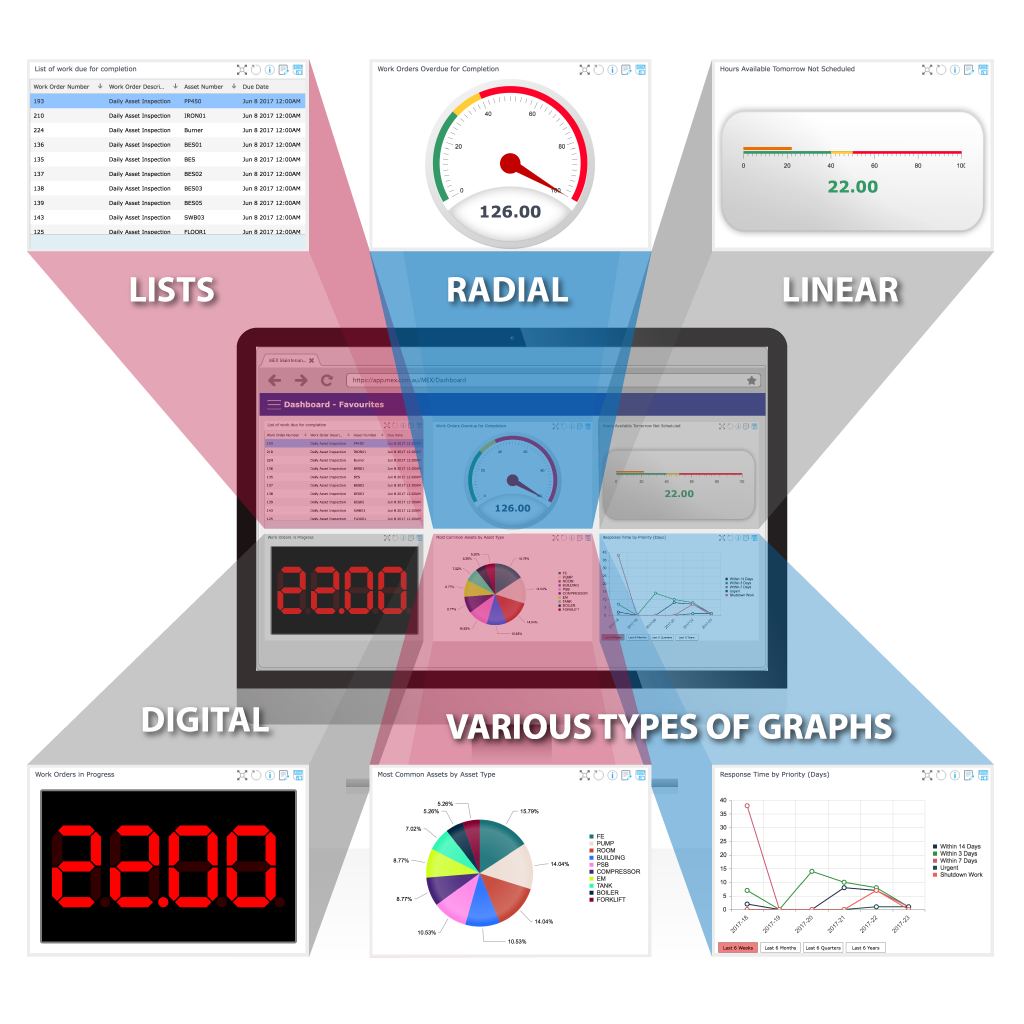
All KPI’s are not static and can be adjusted to suit. Just as it was in the last version, the new Dashboard allows its users to choose what KPI’s are displayed and we don’t stop there. If you don’t find a certain KPI you can easily create one, given the correct knowledge. The MEX Dashboard is a versatile information hub that will go a long way in improving your maintenance management procedures.
For more information, have a look at the MEX Dashboard page: